Household and community level responses to shocks often differ widely. Some can mitigate the effect of a shock and recover rapidly to a level of welfare at or above pre-shock levels. Others may find themselves stuck in a lower level of welfare permanently, a ‘poverty trap’ resulting from non-linear wealth accumulation dynamics (Carter & Barrett 2006). What allows some households to recover, even prosper, in a shock prone environment while others sink deeper into poverty?
In the context of such welfare dynamics we focus on the concept of resilience, which has enjoyed increased popularity in development policy.
Past papers discussed on this blog have sought to measure resilience, but are constrained in their reliance on traditional annual or bi-annual datasets. Concurrently, governments and aid agencies have pioneered ‘early warning systems’, collecting monthly data on food-prices and other indicators of a potential crisis. Yet this data is rarely good enough to allow for econometric analysis, and usually fails to track individual households over time.
The ‘Measuring Indicators for Resilience Analysis’ (MIRA) project was initiated to begin addressing the data deficiencies faced by resilience research. Cornell University and Catholic Relief Services (CRS) have piloted a comprehensive, end-to-end toolkit for collecting and analyzing high-frequency, resilience-related data.
At the heart of the toolkit is a low-burden, monthly survey administered by local village-based enumerators. Equipped with smart-phones, enumerators in the field administer a 10 to 15 minute survey about a household’s well-being, shocks experienced, and any change in asset levels. The data are immediately uploaded to a remote server, allowing near real-time monitoring which can be used by humanitarian agencies to launch targeted policy interventions.
In addition, using a feature called case-management the survey prompts households about shocks previously reported and inquires as to their recovery status. If they reported themselves recovered, their shock status went from 1 to 0. If not, it remained active and they were prompted about it in subsequent rounds.
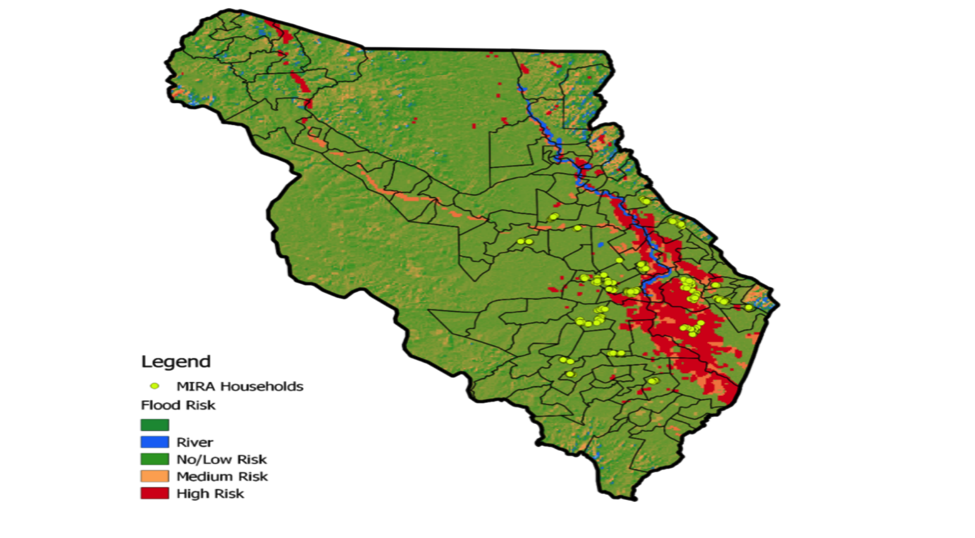
The data collection process was piloted in the Chikwawa district of Malawi, a region that is prone to both flooding and drought. The location of the selected households is shown in Figure 1. Since flooding is inversely correlated to drought exposures, the sample was stratified by level of flood exposure., to allow for exposure to different types of shocks in the sample.
Figure 1: Flood Risk and MIRA Households Sampled
 Source: Flood risk: Dartmouth Flood Observatory
As of February 2017, we have collected nine rounds of data, giving us a snapshot of the evolving series of shocks experienced. The five most frequent shocks are drought, flood, illness, rise in food prices and crop disease.
In the studied timeframe, drought was by far the most frequent shock; over 80% of households reported being affected by drought possibly due to the fact that it was an El Nino year. Certain households were affected by both floods and droughts over the course of the year, reflecting their precarious livelihoods.
With this data, we sought to answer two questions:
- What were the effects of assistance received, if any, on household vulnerability and resilience?
- Could we use this data to accurately predict future shocks incidence, thereby helping in the targeting of assistance?
To frame the first question, we distinguish between two probabilities:
- Probability of Incidence: the probability of experiencing a shock in period t having not experienced a shock in period t-1, or P(Shockit=1 | Shockit+1=0).
- Probability of Recovery: the probability of recovering from a shock in period t having experienced the same shock in period t-1, or P(Shockit=0 | Shockit+1=1).
Using a moments based approach (Barrett & Constas 2014), we define vulnerability as the probability of incidence and Resilience as the probability of recovery. Both of those probabilities can be estimated from our data with an auto-regressive model. Once those probabilities are estimated, we can infer whether a given intervention modifies those probabilities. To address issues of endogeneity, we use a Blundell Bond estimator, instrumenting our variables with their differenced lags.
The table below illustrates this concept. A household without assistance from an NGO has a 50% likelihood of reporting negative effects from drought. A similar household already experiencing drought has a 20% likelihood of recovery.
Figure 2: Resilience and Vulnerability to Drought as Probabilities
 In comparison, a household receiving assistance has only a 20% likelihood of reporting negative effects from drought, a marked decrease in vulnerability. But such a household only has a 10% chance of escaping from negative drought effects, which means the assistance has also decreased its resilience.
Note that nothing imposes that vulnerability and resilience are inversely correlated. Hence this allows us to estimate each separately.
In Part II, we will illustrate how we use machine learning algorithms to predict the future incidence of shocks, with the intention of assisting in the planning of appropriate interventions.


Good job. Two things that I am curious to know:
1. How did you profile and determine the resilience and vulnerability of households in different income (wealth) classes—any results
2. How was the data quality managed such that households who were not receiving any form of assistance did not exaggerate their response either way up or down?