With the growing focus on resilience programming among donors and implementers, resilience measurement is potentially a powerful tool for targeting and evaluating interventions. But who are the non-resilient? Simply, the non-resilient are those individuals (or households) who are likely to live in poverty in the future. This poverty may be structural or stochastic (as a result of a shock), and it is certainly multi-dimensional. Ideally, we would like to target and evaluate programs on many dimensions of well-being, including income, food security, health, education, etc.
Resilience measurement builds on the vulnerability literature (e.g. Christiaensen & Boisvert (2000), Ch. 12 of the Handbook on Poverty and Inequality), which is similarly interested in ex ante measurement of probabilities of well-being. While ex post poverty assessment is important for understanding demographic trends, poverty traps, and the general welfare of the population, forward-looking measures allow us to target the individuals who may or may not be poor today, but who are likely to be poor tomorrow.
While the probabilistic approach to measurement is incredibly powerful, it is also somewhat challenging to implement. Building on theoretical work by Chris Barrett and Mark Constas (2014), we can estimate household level probabilities of well-being by parametrically estimating the mean, variance, and even higher order moments of the individual’s underlying well-being distribution. These probability distributions tell us what the likelihood (i.e., probability) is that a household will achieve a certain level of well-being in any given period.
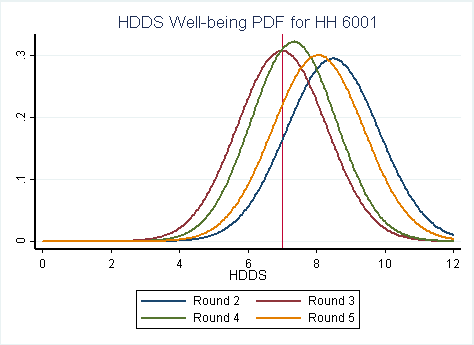
Taking advantage of data on pastoralists in northern Kenya, collected by ILRI with funding from DFID, USAID, and the World Bank, Chris Barrett and I have estimated household level probabilities of well-being in past periods and witnessed how the household’s well-being responds to shocks. In the graph below, we can see that household 6001’s well-being distribution in terms of its household dietary diversity score (HDDS, the number of different food categories consumed by the household in the past week) is initially quite high, but shifts quickly and dramatically to the left following a catastrophic shock prior to Round 3 (the 2011 drought in the Horn of Africa).

As researchers and practitioners, we are able to identify relevant well-being thresholds, which may be, for example, dynamic asset poverty thresholds that indicate the presence of an asset-based poverty trap, or subjective well-being thresholds such as the poverty line. In this case, we have selected the sample mean household dietary diversity score as the well-being threshold, represented on the graph by the vertical red line. In each period, household 6001’s resilience is the portion of their well-being distribution that is above (to the right of) the threshold. We can see that in Round 2, the household is quite resilient, but its resilience score drops to 0.5 (50%) after the drought. Thankfully, the household’s resilience improves in both periods after the drought and by Round 5 it has nearly recaptured its initial level of resilience.
Once we have calculated the resilience of individuals or households in a given area, we can add these scores up using a Foster, Greer, and Thorbecke (FGT, 1984) type aggregator in order to calculate a resilience index. The index allows us to compare resilience across groups, for example male- versus female-headed households or nomadic versus settled households. The figure below contains some preliminary results from our work measuring resilience using the ILRI data. Not only are we able to see that female-headed households are consistently less resilient (in terms of HDDS) than male-headed households, we can also see that settled households have much greater HDDS resilience than nomadic households. And while the settled households do lose quite a bit of resilience after the drought, they are able to regain this resilience quickly. Projecting out (periods 6 and 7), we are able to forecast how the resilience of these groups will evolve in the future (here assuming no further shocks, for example).

Resilience measurement provides us with a powerful targeting tool and, as the ILRI resilience blog series demonstrates, experts around the world are thinking about how best to implement resilience programming in vulnerable areas, such as arid and semi-arid lands. Resilience interventions in northern Kenya might take advantage of this analysis to target female-headed and nomadic households. This measurement approach can also be used to evaluate the impact of projects. In future work, I plan to estimate the impact of an innovative index-based livestock insurance product on resilience in these same communities. I hope to have preliminary results to share this summer, so stay tuned here at ETRM for updates on our work and check out the other posts in the ETRM resilience series.
[A condensed version of this blog post can be found on the ILRI resilience blog series.]

