In my previous post in this series, I discussed the short-term effects of food price shocks on households’ expenditure levels in separable and non-separable models. Here, I take a long-term approach by asking whether repeated exposure to food price shocks might induce the emergence of a poverty trap defined as “(…) any self-reinforcing mechanism which causes poverty to persist (Azariadis and Stachurski, 2005: 326).
As I discussed previously, the recent global food price crisis of the 2000s raised fears among policy makers and development economists about the deterioration of the food security of poor households, the increase of their vulnerability to other types of shocks and stressors, and the risks of poverty traps or low well-being equilibrium. Most existing studies that tackled these issues claimed that many households in poor countries might have been trapped in poverty as a consequence of food price shocks (Akson and Hoekman, 2010). If food price shocks can really lead to poverty traps, then their identification and location become crucial for the implementation of appropriate policies likely to lift households from persistent poverty zones to desirably higher and self-sustained well-being equilibria (Dutta, 2014).
To date, there are no theoretical or empirical studies explicitly linking households’ differential exposure and vulnerability to food price shocks and the existence of poverty traps. In an ongoing research paper, I explore this question using four waves of the Uganda national Panel Surveys (UNPS) collected by the Uganda Bureau of Statistics (UBoS) in 2005/6, 2009/10, 2010/11, and 2011/12.
An obvious complication of linking commodity price instabilities and poverty traps is finding a suitable definition of being exposed to a food price shock. Two practical problems emerge when engaging in such task. First, although the Living Standards Measurement Study-Integrated Surveys on Agriculture (LSMS-ISA) provide information on households’ exposure to different types of shocks (health, agricultural, livestock or other asset shocks), the surveys remain silent with regards to food price shocks. Second, price changes affect households differently depending on their tastes, preferences, composition, or their decision to participate or not in a food market. Hence, observing a large change in food prices in a specific district between two periods does not automatically imply that all households within that district will be identically affected. One way to overcome the above complications is “to locate shocks using a pure statistical definition” (Dehn, 2000: 8).
I uncover the causal effects of food price shocks on the welfare growth (measured using a consumption and asset index) using different econometric strategies (parametric, non- and semi-parametric methods) on around 2,173 Ugandan households followed over the 4 survey periods.
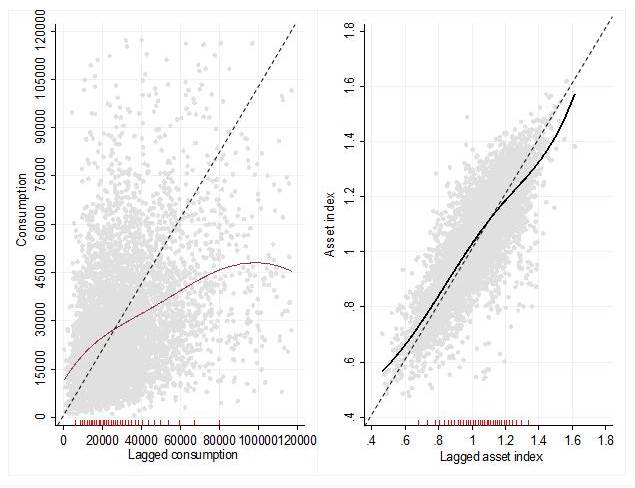
The results suggest the presence of nonlinearities in both consumption and asset dynamics. Furthermore, I find that changes in the degree of exposure to food price shocks tend to decrease the rates of both consumption and asset growth during the sample period, with the effects being more important in the consumption growth model. Concretely, the parametric results show that the consumption growth rate is on average marginally decreasing with the degree of exposure to food price shocks, and this effect is increasing with the extent of household’s vulnerability. The vulnerability threshold to food price shocks is found to be 1.364, meaning that on average the effect of food price shocks starts inducing detrimental impacts on consumption growth once the vulnerability index exceeds this level, and this was the case of around 58% of surveyed households. However, I do not find any evidence of food price shock-induced poverty traps or bifurcated welfare dynamics necessary for the existence of multiple welfare equilibria (Carter and Barrett, 2006; Barrett and Carter, 2013). Instead, graphical representations of the predicted consumption levels and asset indices reveal that Ugandan households are converging towards a single welfare equilibrium located slightly above the official poverty line.
When households are disaggregated into different sub-groups sharing some similarities, the econometric results suggest that different household groups appear to be moving towards specific welfare equilibria. For instance, households exposed to food price shocks are moving towards a consumption threshold that is 6.5% lower than the equilibria of their unexposed counterparts. Households located below the vulnerability threshold 1.364 (meaning less vulnerable households) are expected to reach a welfare equilibrium that is on average 57.1% greater than that of households beyond the estimated critical vulnerability index. Hence, there is evidence of conditional convergence across groups of households with female-educated, less educated, highly exposed and vulnerable households to food price shocks converging towards lower consumption and asset equilibria, regardless of the selected econometric method.


