As discussed in a prior post, the objective of proxy means test targeting is to identify households in developing countries in need of a transfer using a simple model parameterized with previously available data. The primary challenge in developing such poverty assessment tools is achieving high out-of-sample prediction accuracy.
In our paper, Improved poverty targeting through machine learning: An application to the USAID Poverty Assessment Tools,** Austin Nichols and I apply stochastic ensemble methods to achieve significant gains in targeting accuracy. In particular, we use the random forest algorithm, developed by Breiman and Cutler, to produce gains in accuracy from 2 to 18 percent across case study countries.
The random forest algorithm produces predictive models by averaging across a forest of de-correlated regression trees built through a recursive binary partitioning process over subsets of data. Regression trees recursively partition a feature space to minimize distance between observed and predicted outcomes (Hastie, Tibshirani, and Friedman 2009). An ensemble of trees, i.e., a forest, averages across many trees built in this manner on randomly drawn subsets of the data; the averaging creates a prediction that is far less noisy than that of a single tree. The prediction error for each tree is estimated in the portion of the data not used to construct that tree. Averaging across these estimates offers an unbiased estimate of the out-of-sample prediction error (Breiman 1996).
Stochastic ensemble methods introduce randomness to the construction of the trees by allowing the algorithm to select from only a random subset of the available features for any given partition. This restriction de-correlates the trees for an overall reduction in the variance of the predictor (Breiman 2001).
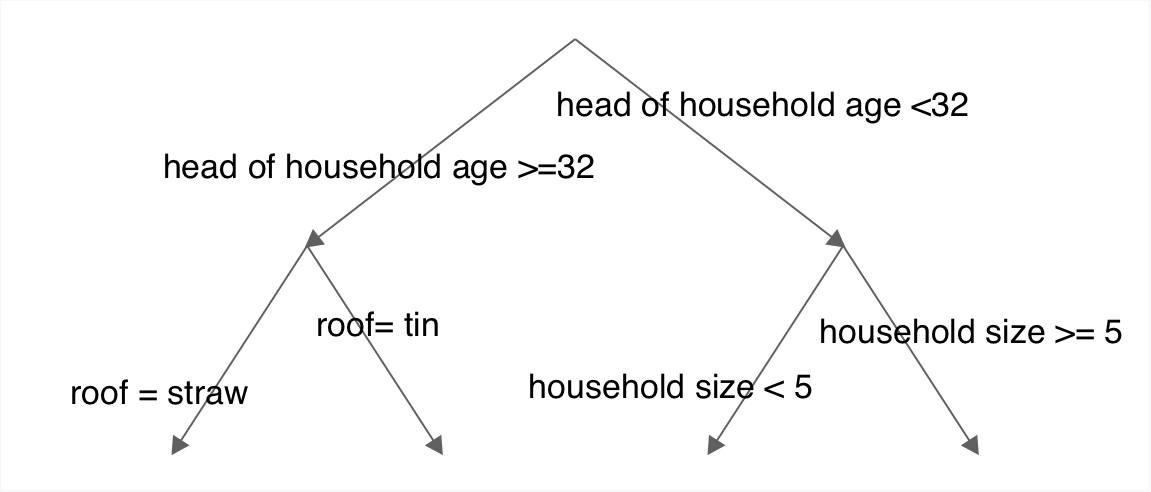
To illustrate the process, the figure below shows a regression tree built in our data by partitioning observed household characteristics at a value of one characteristic to minimize the distance between mean and actual outcome within the two resulting regions. In the top two branches, the algorithm has selected the age of the head of household as the characteristic, and a split at age 32, as the optimal partition among the feature space chosen at random for candidate splits. The recursive binary splitting algorithm then proceeds to partition again, in the lower branches where the algorithm has selected the size of the household and the material used to construct the roof of the home as the next error minimizing partitions.

Regression forests offer consistent and approximately unbiased estimates of the conditional mean of a response variable (Breiman 2004). As elaborated by Koenker (2005), among others, the conditional mean tells only part of the story of the conditional distribution of y given X. So we also apply quantile regression forests, as developed by Meinshausen (2006), to our tool development. Meinshausen (2006) produces quantile regression forests as a generalization of regression forests in which the entire conditional distribution of the response variable is estimated. A quantile approach is particularly useful for the purposes of tool development due to the fact that the very poor are often concentrated at one end of the conditional income distribution, far from the conditional mean.
We produce a set of country-specific examples from the survey data used by the University of Maryland IRIS Center to construct the USAID poverty assessment tools in Bolivia, East Timor, and Malawi. The approach is to randomly draw, with replacement, two samples of half of each country level data set, producing a training sample and a testing sample. The random forest models are built in the training sample. The resulting model is then taken to the testing sample to assess classification accuracy. Following the methodology for out-of-sample testing used by the IRIS Center, we test the model using 1000 bootstrapped samples of the testing sample.
Note that, in principle, the division into training and validation sets is unnecessary when using a stochastic ensemble method, since unbiased out-of-sample statistics are always produced in the training data. By only using half the data, we are stacking the deck against the stochastic ensemble method.
Our out-of-sample accuracy tests are compared with those provided by the IRIS Center in the figure below. Gains in poverty accuracy (correctly predicted poor as a percentage of the total true poor) range from a 2 percent improvement in Malawi to an 8 percent improvement in Bolivia. The leakage and undercoverage graphs indicate that these gains in poverty accuracy are not without trade-offs: the leakage rates for the ensemble-method tools are significantly greater than those reported for the IRIS generated tools in both Bolivia and East Timor. However, the ensemble-method tool performs much better than IRIS’s in terms of undercoverage rates.
Finally, for ex-ante evaluation of tool performance, we assess how these trade-offs net out in terms of USAID’s key accuracy metric, which they call the balanced poverty accuracy criterion (BPAC). The BPAC is calculated as poverty accuracy minus the absolute difference between undercoverage and leakage rates. The figure shows that the BPAC of the ensemble-method tool out-performs that of the IRIS generated tool in each country; improvements range from 2 percent in Malawi to 18 percent in Bolivia. See the paper for more details on accuracy evaluation.

As recently covered by The Economist, accurate targeting of social spending is difficult. Application of stochastic ensemble methods to the problem of developing a poverty-targeting tool produces a significant gain in poverty accuracy, a significant reduction in undercoverage, and an overall improvement in BPAC, allowing those interested in accurate targeting to, at the very least, get the most out of the available data.
**This paper has been revised and published under a new title, Re-tooling poverty targeting using out-of-sample validation and machine learning.

